

Comparing recent sold house prices is defined as analysing actual completed sale data for similar properties to establish what a home is genuinely worth in the current market. Asking prices reflect seller ambition; sold prices reflect reality. In the UK, official sources such as the Land Registry Price Paid dataset, Zoopla, and Rightmove give buyers and investors access to this real transaction data. Used correctly, it tells you whether a listing is fairly priced, overpriced, or a genuine opportunity. This guide walks you through the tools, the method, and the mistakes to avoid.
What tools can you use to compare recent sold house prices?
The Land Registry Price Paid dataset is the most authoritative source of sold house price data in England and Wales. It records every residential sale since 1995, including price paid, sale date, address, property type, and tenure. That depth of history makes it uniquely useful for spotting long-term trends in a specific street or postcode. The one critical limitation: recent two months' data is incomplete due to registration lag, so treat the most recent entries with caution.
Beyond the Land Registry, three major property portals give buyers a more accessible way to check sold house values:
- Rightmove Sold Prices: Pulls Land Registry data into a searchable map interface. You can filter by property type, number of bedrooms, and date range. Rightmove also overlays current listings, so you can directly compare asking prices against what similar homes actually sold for nearby.
- Zoopla Sold Prices: Offers similar functionality with the addition of estimated current values for most properties. Zoopla's estimates are algorithmically generated, so treat them as a starting point rather than a definitive figure.
- OnTheMarket: Smaller portal with sold price data, useful for cross-referencing when Rightmove or Zoopla show limited results in rural or lower-volume markets.
| Source | Data Coverage | Freshness | Best For |
|---|---|---|---|
| Land Registry | England and Wales, 1995 to present | 2-month lag | Definitive historical records |
| Rightmove | England and Wales | Near real-time display | Quick visual comparisons |
| Zoopla | UK-wide | Near real-time display | Estimated valuations alongside sold data |
| OnTheMarket | UK-wide | Near real-time display | Cross-referencing in quieter markets |
Pro Tip: For developers and data-savvy investors, the Land Registry offers a SPARQL API endpoint that allows automated retrieval of sold transactions by postcode. This enables you to build dynamic comparison tools integrated directly into your decision workflow.

How do you select appropriate comparables?
Comparable sales, known in the industry as "comps," are the foundation of any credible sold price analysis. A comp is only useful if it closely mirrors the property you are evaluating. Selecting comps sold within the last 3–6 months significantly improves valuation accuracy. Markets shift quickly, and a sale from 18 months ago may reflect entirely different conditions.
Follow these steps to build a reliable set of comparables:
- Start on the same street. Properties on the same road share identical location characteristics: school catchment areas, noise levels, and proximity to amenities. Same-street sales are the strongest comps available.
- Match property type precisely. A three-bedroom semi-detached is not a reliable comp for a three-bedroom detached, even on the same road. Detached homes consistently command a premium.
- Match approximate floor area. Where floor area data is available via the Energy Performance Certificate register, use it. A 10% difference in size can represent tens of thousands of pounds in value.
- Prioritise recency. Use sales from the last 3–6 months as your primary set. Sales from 6–12 months ago can serve as secondary reference points, particularly in low-volume markets.
- Adjust for condition and features. A recently refurbished property will sell above an unmodernised equivalent. Note these differences and factor them into your analysis.
Pro Tip: The Energy Performance Certificate (EPC) register, available free via the government's Find an Energy Certificate service, lists floor area for most UK properties. Cross-reference this with sold price data to calculate a reliable price-per-square-metre figure for your target area.
What are the steps to effectively analyse sold property prices?
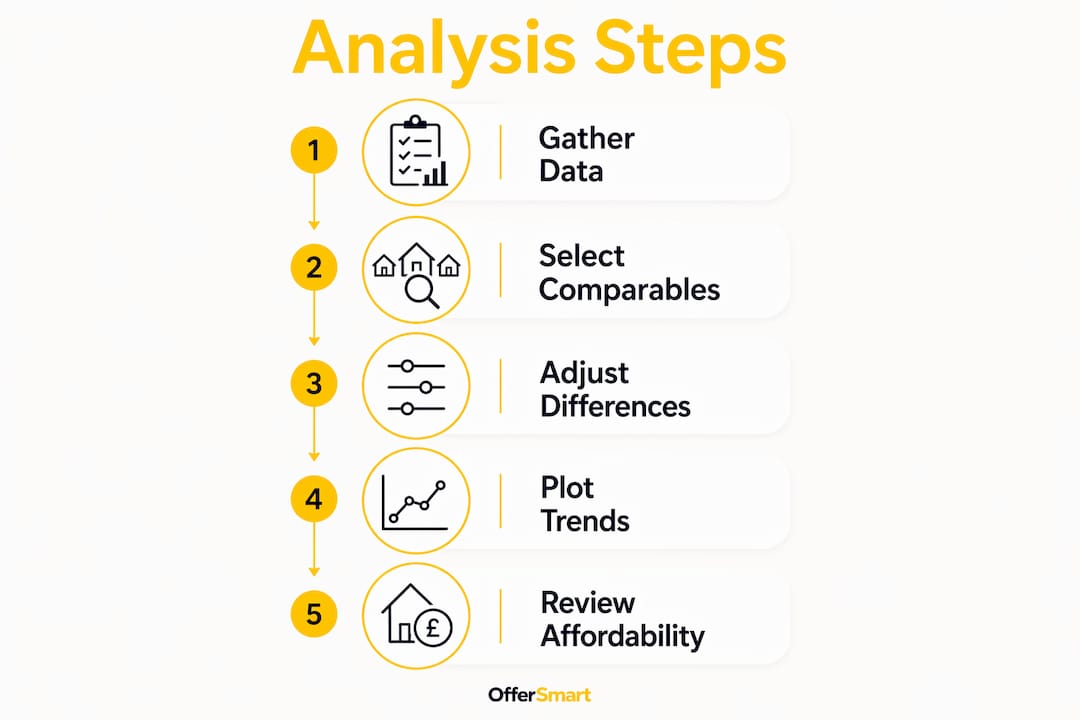
A structured approach to home sale price analysis removes guesswork and gives you a defensible number to base your offer on. Here is the framework:
-
Gather your data. Search Rightmove or Zoopla for sold prices within a half-mile radius of your target property. Filter for the same property type and at least three bedrooms if applicable. Download or note at least five to ten recent sales.
-
Filter for relevance. Remove any sales older than six months unless the market is very thin. Remove properties that differ significantly in type, size, or condition. You want a tight, comparable set, not a broad average.
-
Build a comparison table. Record each comp's address, sale date, price, size (if known), and any notable features. A simple spreadsheet works well here.
| Address | Sale Date | Sale Price | Type | Notes |
|---|---|---|---|---|
| 14 Example Road | March 2026 | £310,000 | 3-bed semi | Newly refurbished kitchen |
| 22 Example Road | January 2026 | £295,000 | 3-bed semi | Standard condition |
| 7 Nearby Close | February 2026 | £302,000 | 3-bed semi | Extended rear |
-
Adjust for differences. Adjusting sale prices for differences in features, condition, and location is the core of the Sales Comparison Approach used by professional valuers. If your target property lacks the refurbished kitchen that added value to a comp, deduct a realistic local market figure. Quantify each adjustment rather than relying on gut feel.
-
Calculate a weighted average. Give more weight to the most recent and most similar sales. If two comps are near-identical to your target and one is six months old, the recent one should carry more influence in your final figure.
-
Layer in broader market context. Check whether prices in the area are rising or falling. A flat or declining market means your adjusted average may still be slightly high if the trend continues.
Pro Tip: Use a simple chart to plot your comps by sale date and price. A visual trend line immediately shows whether local prices are moving up, down, or sideways, which is information a raw average cannot convey.
What common mistakes should you avoid when comparing sold property prices?
The most damaging mistake buyers make is treating asking prices as a proxy for market value. Over-optimistic seller asking prices lead to longer selling times and eventual reductions. Rightmove's May 2026 data showed asking prices at £378,304 on average, while the UK average sold price in March 2026 was £268,000 according to the UK House Price Index. That gap illustrates why sold data, not listed data, is the only reliable benchmark.
Other common errors to avoid:
- Using stale comparables. Sales from more than 12 months ago may reflect a different interest rate environment, seasonal demand, or local supply conditions. Stick to the 3–6 month window wherever possible.
- Ignoring registration lag. Best practice excludes Land Registry records from the most recent two months when conducting trend analysis. A thin dataset from the last eight weeks can skew your conclusions.
- Mixing property types. Flats and houses do not compare directly. Leasehold and freehold properties carry different values. Always filter by the correct tenure and type.
- Overlooking local variation. National and regional averages mask significant postcode-level differences. A street two minutes' walk from a train station can command 10–15% more than a parallel street without that access.
- Relying on a single source. No single portal or dataset is complete. Cross-reference Land Registry data with Rightmove and Zoopla to catch any gaps.
"Sold price data tells you what buyers actually paid. Asking price data tells you what sellers hoped to receive. Only one of those figures is grounded in reality."
How do you combine sold prices with market trends and mortgage affordability?
Sold price comparisons give you a precise local picture, but they need context. The UK House Price Index provides that context at a national and regional level. Combining official UK HPI data with local sold price data delivers the most reliable insight into true market values. Regional figures matter: England averaged £290,000, Wales £213,000, Scotland £187,000, and Northern Ireland £198,000 in March 2026. A buyer in Cardiff and a buyer in Bristol face very different markets, even if national headlines suggest similar conditions.
| Region | Average Sold Price (March 2026) | Trend Signal |
|---|---|---|
| England | £290,000 | Use as regional baseline |
| Wales | £213,000 | Below UK average; watch local demand |
| Scotland | £187,000 | Separate legal system; verify with Scottish data |
| Northern Ireland | £198,000 | Separate index; use NI-specific sources |
Mortgage affordability is the other half of the equation. Current mortgage rates directly affect what buyers can borrow, which in turn affects what they will pay. A property priced at £300,000 in a rising-rate environment may attract fewer competing offers than the same property six months earlier. Factor this into your offer strategy by reviewing current lender rates alongside your sold price analysis. Offersmart's mortgage calculator lets you model repayments against any offer price, so you can test affordability before committing.
Pro Tip: Check whether regional property finance trends in your target area show signs of tightening or loosening credit conditions. Lender appetite affects buyer demand, which feeds directly into sold prices over the following months.
Key takeaways
Combining Land Registry sold price data with local comparables and UK HPI context gives you the most accurate basis for any property offer or investment decision.
| Point | Details |
|---|---|
| Use sold prices, not asking prices | Sold data reflects what buyers actually paid; asking prices reflect seller expectations only. |
| Apply the 3–6 month rule | Comparables older than six months may reflect a different market and should be used with caution. |
| Account for registration lag | Exclude the most recent two months of Land Registry data from trend analysis to avoid incomplete records. |
| Adjust for property differences | Quantify variations in size, condition, and features rather than relying on unadjusted averages. |
| Layer in regional context | National averages mask local variation; always validate comps against postcode-level data. |
Why single-source analysis has cost buyers dearly
I have reviewed hundreds of property decisions where buyers overpaid, and the pattern is almost always the same. They found a property they loved, checked one portal, saw a couple of nearby sales, and made an offer. No adjustment for condition. No check against the Land Registry. No awareness that the two most recent sales in the area had not yet registered.
The buyers who get this right treat sold price comparison the way a surveyor would. They build a table. They note the differences between each comp and the subject property. They apply a figure to each difference based on what the local market actually values, not what feels right. That last part is where most people fall short. Quantifying adjustments precisely, as the Sales Comparison Approach requires, takes discipline. But it is the difference between a confident offer and an expensive guess.
My strongest advice: never rely on a single data source, and never skip the adjustment step. Zoopla's estimated values are a starting point, not a conclusion. Rightmove's sold price map is useful, but it does not tell you that the house which sold for £320,000 last month had a brand-new extension. You need to dig into the detail. When you do, you will find that using local property data to inform your offer is one of the most reliable ways to avoid overpaying in any market condition.
— Rhys
Make your next offer with real data behind it
Understanding sold prices is only half the work. The other half is knowing what you can afford and whether the numbers stack up before you make an offer.

Offersmart brings both sides together in one place. Enter any UK property address or paste a listing link, and Offersmart instantly analyses recent local sales, including properties on the same road, to show you what a fair offer looks like. It also calculates rental yield, estimated running costs, and a five-year value forecast. Use the Offersmart mortgage calculator to model your repayments against any offer price, or explore the full suite of property calculators to build a complete financial picture before you commit.
FAQ
What is the most reliable source for sold house prices in the UK?
The Land Registry Price Paid dataset is the most authoritative source, covering every residential sale in England and Wales since 1995. Rightmove and Zoopla display this data in a more accessible format for everyday buyers.
How recent should my comparable sales be?
Comparables sold within the last 3–6 months provide the most accurate basis for valuation. Sales older than 12 months may reflect a different interest rate or demand environment and should be used only as secondary reference points.
Why is there a gap between asking prices and sold prices?
Sellers frequently list above market value, and over-optimistic asking prices lead to longer selling times and eventual reductions. The UK average asking price in May 2026 was £378,304, while the average sold price in March 2026 was £268,000, illustrating the scale of this gap.
How do i adjust for differences between comparable properties?
Identify specific differences such as floor area, condition, parking, or garden size, then assign a monetary value to each based on what the local market supports. This is the Sales Comparison Approach used by professional valuers and surveyors.
Can i use sold price data to decide how much to offer on a house?
Yes. Analysing recent comparable sales, adjusting for property differences, and cross-referencing with the UK House Price Index gives you a data-backed figure to base your offer on. Tools like Offersmart automate much of this process for UK buyers.