
When you find a property you love, the asking price feels like the whole story. It rarely is. A property listing analysis is the systematic process of evaluating a property's true market value by examining comparable sales, financial metrics, and local market conditions before you commit to an offer. For UK homebuyers and investors alike, skipping this step is where costly mistakes begin. This guide explains exactly what a property listing analysis involves, how to conduct one, and how to apply the results to make confident, data-backed decisions.
Table of Contents
- Key takeaways
- What is a property listing analysis?
- Key financial metrics for property investors
- How to conduct a listing analysis in the UK
- Using analysis results to make informed decisions
- Common mistakes when analysing property listings
- My view on property listing analysis in the UK
- Make smarter offers with Offersmart
- FAQ
Key takeaways
| Point | Details |
|---|---|
| More than asking price | A listing analysis examines comparables, financial metrics, and local data to reveal true market value. |
| Comparable data expires quickly | Sales data older than six months is generally considered outdated in fast-moving UK markets. |
| Investors need specific metrics | Cap Rate, NOI, and Cash-on-Cash Return reveal profitability beyond what the asking price alone shows. |
| Red flags exist in the data | High listing views with low enquiries signal mispricing or poor listing framing before you even visit. |
| Multiple analyses outperform one | Requesting several market analyses from different agents triangulates a realistic and reliable price range. |
What is a property listing analysis?
A property listing analysis is a structured evaluation of a property listing to determine its fair market value and, for investors, its income potential. It goes well beyond reading the description on Rightmove or Zoopla. The core of any listing analysis is the Comparative Market Analysis, or CMA. This process compares the subject property against three to five similar recently sold properties in the same area, adjusting for differences in size, condition, and features.
A CMA is not the same as a formal appraisal. A CMA is an informed professional opinion without legal standing, whereas a licensed appraisal is a certified valuation required by mortgage lenders and used in legal proceedings such as estate settlements. Automated Valuation Models (AVMs), the kind you see on property portals, are faster but less reliable because they cannot account for condition, presentation, or hyper-local demand.
A thorough listing analysis draws on three types of data:
- Sold comparables. Recently completed transactions on similar properties within the same postcode or street. These are the most reliable because they reflect what buyers have actually paid.
- Active listings. Current competition on the market. These show the ceiling of what sellers are asking, though not necessarily what they will achieve.
- Expired listings. Properties that failed to sell at their listed price. These are often overlooked but are among the most telling signals of overpricing in a local market.
Overpriced homes are 45% more likely to expire unsold, which is why understanding how comparables inform pricing is so useful to buyers. If you spot a property that has been re-listed after expiring, that is your starting point for negotiation.
Key financial metrics for property investors
For buyers purchasing a home to live in, listing analysis centres on fair value. For investors, financial metrics are what turn raw listing data into a decision. Understanding these figures is not optional. It is the difference between a profitable acquisition and an expensive lesson.
Here are the four metrics every property investor should know before making an offer:
-
Net Operating Income (NOI). This is the annual rental income minus all operating expenses, excluding mortgage payments. If a flat generates £18,000 per year in rent and costs £5,000 to run, the NOI is £13,000. NOI tells you how efficiently the property generates income.
-
Capitalisation Rate (Cap Rate). This divides NOI by the property's current market value and expresses the result as a percentage. A Cap Rate of 6% means the property returns 6p for every £1 of its value annually. Higher Cap Rates generally indicate higher risk, so context matters considerably.
-
Cash-on-Cash Return (CoC). This measures the return on the actual cash you have invested, accounting for mortgage debt. It is calculated by dividing annual pre-tax cash flow by the total cash invested. CoC is particularly relevant for UK investors using leverage, as it reflects what your deposit is actually earning.
-
Gross Rent Multiplier (GRM). This is the property price divided by annual gross rent. A GRM of 12 means you would recoup the purchase price in 12 years of gross rental income. Lower GRMs are generally preferable, though local market norms vary significantly across UK cities.
Professional investors use NOI, Cap Rate, and Cash-on-Cash Return to set offer prices and screen opportunities quickly. What many buyers miss is that these figures must be calculated based on realistic, local rental data rather than optimistic projections.
Pro Tip: Never use a landlord's stated rental income without verifying it against current local rents. Markets shift, and the figure quoted in a listing may reflect what was achievable two years ago, not today.
Financial analysis must be combined with physical due diligence and an assessment of local demand. Strong metrics on paper can still lead to poor outcomes if the local rental market is softening or the property has structural issues not visible in the listing.

How to conduct a listing analysis in the UK
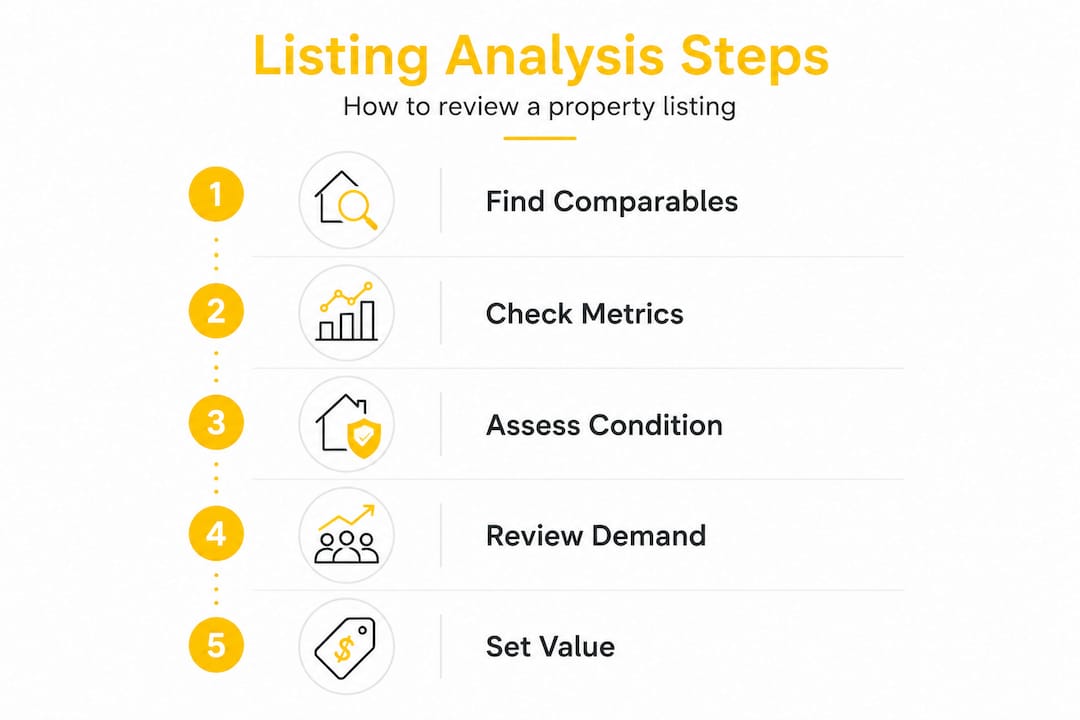
The process of analysing a property listing follows a logical sequence. Rushing any stage weakens the output. Here is how a methodical real estate listing evaluation works in practice:
-
Step 1: Gather subject property details. Record the property's size in square metres, number of bedrooms and bathrooms, EPC rating, parking, garden, tenure (freehold or leasehold), and any recent improvements. These details form the baseline for comparison.
-
Step 2: Source recent comparables. Search for sold prices on the same road or within a half-mile radius using Land Registry data and property portals. Sales data older than six months is generally considered outdated in fast-moving markets, so focus your comparables within that window wherever possible.
-
Step 3: Adjust for differences. No two properties are identical. Adjustments to comparables for specific features such as a converted loft or a finished basement typically range from 2% to 10% of value. For example, if a comparable sold for £350,000 and had a garage that your subject property lacks, you would subtract an estimated value for that garage from the comparable's price.
-
Step 4: Evaluate active and expired listings. Active listings set pricing expectations for the current market. Expired listings reveal the price ceiling buyers have consistently refused. Both are signals about where the market sits relative to the asking price you are evaluating.
-
Step 5: Examine listing metrics. How a property performs as a listing tells you something about its pricing and presentation.
The table below illustrates how different listing metric combinations should inform your interpretation:
| Views | Enquiries | What it signals |
|---|---|---|
| High | High | Strong demand, correctly priced or undersupplied area |
| High | Low | Possible mispricing or poor listing quality |
| Low | Low | Poor marketing, limited exposure |
| Low | High | Niche interest, motivated pool of buyers |
High views with low enquiries suggest mispricing or poor listing framing. This is a meaningful signal before you even book a viewing. If the data shows a property attracting clicks but no serious interest, the market is telling you something the asking price does not.
Energy performance is worth factoring into your adjustments. The EPC rating affects running costs and, increasingly, mortgage eligibility for buy-to-let investors. A poorly rated property may require capital expenditure to meet future regulations, which should reduce your offer.
Using analysis results to make informed decisions
A completed analysis only has value if you apply it correctly. Here is how to translate your findings into real decisions.
Setting a realistic offer starts with your comparable evidence. If the data consistently suggests a fair value of £280,000 and the asking price is £310,000, you have a clear basis for a lower offer. Understanding how much below asking price to offer in the current UK market requires combining this comparable evidence with knowledge of local supply and demand.
For investors, the financial metrics you have calculated should feed directly into your offer ceiling. If your target Cap Rate is 6% and your calculations show the property only delivers 4.2% at the asking price, you know exactly what price point makes the investment work.
Pro Tip: Always factor in stamp duty, solicitor fees, and any anticipated repair costs before calculating your maximum offer. These costs are not optional extras. They directly affect your returns and your budget.
The warning signs to watch for in listing data include:
- A property that has been on the market for more than 90 days without a price reduction
- Multiple re-listings under different estate agents across the past year
- Asking price significantly above the highest comparable sold price in the street
- Rental yield projections that rely on above-market rent figures
- Listing views that do not convert to enquiries, indicating the wider market has assessed and rejected the pricing
Integrating your analysis with a mortgage calculator and stamp duty estimate gives you a complete financial picture. Tools like the Offersmart mortgage calculator allow you to model different purchase prices against your deposit and income, so you can see at exactly what price the numbers work for you.
Common mistakes when analysing property listings
Most errors in property listing analysis fall into predictable patterns. Knowing them in advance saves you time and money.
- Confusing a CMA with an appraisal or an online estimate. These three tools have different purposes, accuracy levels, and legal standing. Using an AVM alone to set your offer is not a rigorous real estate listing evaluation.
- Using outdated comparables. A sale from 14 months ago in a market that has moved 8% tells you very little about today's value.
- Ignoring expired listings. These are some of the clearest signals that a price point is unsustainable in the local market.
- Relying on a single market analysis. Obtaining several CMAs from different agents allows you to triangulate a price range and assess which agent genuinely understands the local micro-market.
- Treating listing views as demand. High visibility alone is insufficient. Enquiry levels are what reveal genuine buyer interest.
"Turning scattered listing data into a data-backed plan is what moves buyers from emotional decisions to risk-managed ones." A single report gives you a snapshot. Multiple sources give you a picture.
A hybrid approach combining online valuations with agent-prepared CMAs consistently produces the most reliable results, particularly in areas where local knowledge is the decisive factor.
My view on property listing analysis in the UK
I have reviewed a considerable number of property listings across different UK markets, from inner-city flats to rural conversions, and the single most consistent mistake I see is buyers treating the asking price as the starting point for negotiation without doing the analytical groundwork first.
The asking price is not a valuation. It is a marketing position. In my experience, buyers who arrive at a viewing armed with comparable data, a financial model, and an understanding of the listing's performance metrics negotiate from a position of genuine strength. Those who do not tend to overpay or walk away without knowing why a deal did not feel right.
What I find is underused, almost universally, is the views-to-enquiry rate. It is one of the earliest indicators that a property is mispriced or poorly presented, yet most buyers never look at it. I would also caution against putting too much weight on any single CMA. I have seen two agents produce valuations more than £40,000 apart on the same property, both with plausible justifications. That gap is not an error. It reflects the interpretive nature of property valuation and why local property data must be used intelligently rather than taken at face value.
Markets shift quickly. An analysis conducted in January may be meaningfully different from one conducted in March. Update your comparables regularly and treat your analysis as a living document, not a single exercise.
— Rhys
Make smarter offers with Offersmart
Understanding the theory of property listing analysis is one thing. Having the tools to apply it in real time is another entirely.

Offersmart is built specifically for UK buyers and investors who want clarity before committing. Paste a property link or enter an address, and Offersmart instantly compares recent local sales, calculates rental value and estimated ROI, assesses flood and crime risk, and forecasts five-year value potential. The built-in mortgage calculator and the full calculators suite let you model your finances against any asking price in minutes. No guesswork. No overpaying. Just data you can act on.
FAQ
What is a property listing analysis in simple terms?
A property listing analysis is a structured evaluation of a property's market value using comparable sales, financial metrics, and local market data. It helps buyers and investors determine what a fair offer looks like before committing.
How is a CMA different from a property appraisal?
A CMA is an informed estimate prepared by an estate agent with no legal standing, while a licensed appraisal is a certified valuation required by mortgage lenders and used in legal proceedings.
What financial metrics matter most for investment properties?
Net Operating Income, Cap Rate, and Cash-on-Cash Return are the core metrics. They measure how much a property earns relative to its cost and the cash you have invested, which directly informs offer strategy.
How often should I update my property analysis?
In fast-moving UK markets, sales data older than six months is generally considered outdated. Review and update your comparables regularly, particularly if your search has extended over several months.
What does a high views-to-low-enquiry rate mean for a listing?
It typically signals that the property is mispriced or poorly presented. The market is expressing interest but not enough confidence to enquire, which gives buyers a strong basis for a reduced offer.