

Property data analysis is the systematic process of collecting, cleaning, and modelling raw property information to produce clear, actionable intelligence for real estate decisions. For buyers and investors in the UK, it transforms scattered records, such as tax assessments, sales histories, and lease agreements, into financial metrics that reveal whether a property is worth its asking price. The industry term for this discipline is real estate data analysis, and it sits at the heart of every credible investment decision. Done well, it replaces gut feeling with evidence, and asking prices with justified offers.
What is property data analysis and why does it matter?
Property data analysis involves systematically collecting, cleaning, and modelling raw property information to uncover patterns for investment insight. The process draws from fragmented sources including financial records, market listings, and physical property characteristics. Without it, investors rely on incomplete pictures and risk overpaying or missing hidden problems.
The importance of property data analysis becomes clear when you consider what it replaces. Before structured analysis, buyers compared properties by memory or instinct. Now, a disciplined approach to real estate data analysis produces measurable outputs: Net Operating Income (NOI), Capitalisation Rate (Cap Rate), and comparable sales benchmarks that anchor every negotiation.

For individual buyers, the benefits of property data analysis are equally direct. You can verify whether an asking price reflects actual local sales, assess flood and crime risk, and model running costs before committing. That clarity is the difference between a confident offer and a costly mistake.
What data sources and types are used in property analysis?
The quality of any analysis depends entirely on the quality of the data feeding it. Property data falls into three broad categories, each serving a different analytical purpose.
Financial data forms the foundation:
- Tax records and council tax banding
- Operating expenses and service charge histories
- Rent rolls and current lease agreements
- Mortgage and title information
Market data provides the comparative context:
- Recent sales history on the same road and postcode
- Comparable active listings and asking prices
- Historical price trends over 5–10 year periods
- Lease terms and rental yield benchmarks
Physical and location data rounds out the picture:
- Property size, age, and condition records
- Zoning classifications and planning permissions
- Aerial imagery and foot traffic patterns, which reveal consumer behaviour and competitive surroundings that traditional valuations miss
- Flood risk mapping and environmental assessments
The central challenge is that these sources rarely arrive in one place. Most investors struggle with fragmented data because they lack a unified strategy that integrates front-of-house and back-of-house sources. That fragmentation slows decisions and introduces errors. A unified data architecture, where financial, market, and location records feed a single analytical view, is what separates reactive analysis from predictive strategy.
Pro Tip: Before you analyse any property, request the last three years of service charge accounts, not just the current year. Historic trends in maintenance spend reveal far more about a building's condition than a single snapshot.
What are the core financial metrics in property data analysis?
Financial metrics are the language of property investment analysis. Understanding them lets you compare any two properties on equal terms, regardless of location or property type.
-
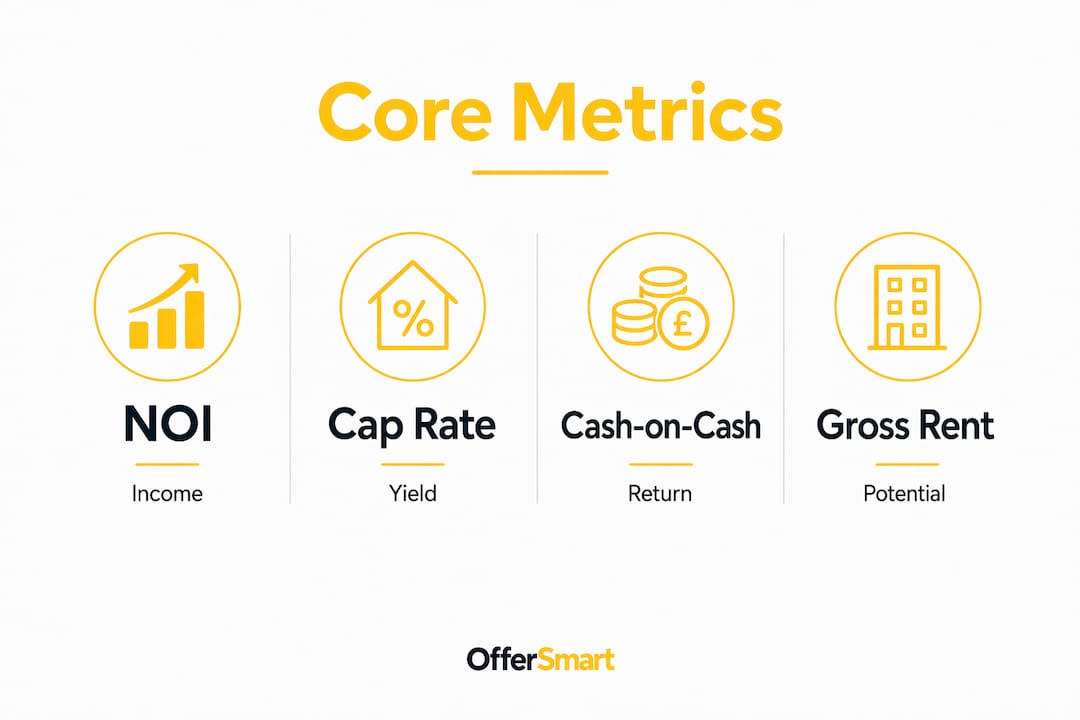
Net Operating Income (NOI). NOI is annual rental income minus all operating expenses, excluding mortgage payments. It tells you how much a property earns before financing costs. A positive NOI is the minimum threshold for any viable investment.
-
Capitalisation Rate (Cap Rate). Cap Rate divides NOI by the property's current market value, expressed as a percentage. A higher Cap Rate signals higher yield but often higher risk. Most UK residential investors target Cap Rates that reflect local rental market norms.
-
Cash-on-cash return. This metric divides annual pre-tax cash flow by the total cash invested, including deposit and purchase costs. It measures the actual return on your money, not the property's theoretical value.
-
Total return modelling. Experienced analysts spend 30–60 minutes per property verifying market rents and building financial models that project returns over 5–10 year holding periods. That time investment prevents expensive assumptions from compounding over a decade.
-
Sensitivity and stress testing. Stress testing investment models by varying key assumptions, such as interest rates and vacancy rates, is the most frequently skipped step in property analysis. It is also the most valuable. A deal that only works at today's interest rate is not a deal worth making.
-
Propensity modelling and distress data. A 66% year-over-year rise in commercial real estate loan modifications shows why distress data, including tax liens and pre-foreclosure notices, matters. Analysts use this data to identify motivated sellers before properties reach the open market.
| Metric | What it measures | Typical use |
|---|---|---|
| NOI | Annual income after operating costs | Baseline profitability check |
| Cap Rate | Yield relative to market value | Comparing investment properties |
| Cash-on-cash return | Return on actual cash invested | Financing efficiency |
| Total return (5–10 yr) | Long-term investment performance | Portfolio planning |
| Sensitivity analysis | Return range under variable conditions | Risk assessment |
Pro Tip: Run your Cap Rate calculation using both the asking price and a 10% lower purchase price. The difference shows you exactly how much negotiating room is worth in yield terms, and gives you a concrete number to take into any offer discussion.
How do modern tools improve property data analysis?
The shift from manual spreadsheets to automated dashboards has changed what is possible for individual investors. Spreadsheets require you to source, clean, and model data yourself. Automated platforms pull from multiple data feeds and present outputs in real time.
Automated dashboards and analytics tools unify data and create a shared language across leasing agents, facilities directors, and investors. Shared visualisation tools reduce conflicts and speed decisions across functions. That matters most when multiple stakeholders need to agree on a property's value or a portfolio's performance.
Location intelligence has become a standard input in modern analysis. Aerial imagery and mobile device foot traffic data are now essential for understanding consumer behaviour and competitive surroundings. A retail unit's value, for example, depends heavily on pedestrian flow, not just its square footage.
The practical benefits of integrated data tools include:
- Faster initial screening of large property lists
- Reduced manual data entry errors
- Consistent financial modelling templates across a portfolio
- Clear audit trails for every assumption and data source
- Easier communication of findings to lenders, partners, or advisers
For UK buyers using tools like Offersmart, this integration is already built in. Enter an address or paste a listing link, and the platform compares recent local sales, calculates rental value and estimated ROI, and surfaces flood risk, crime data, and school proximity in a single report. That is the practical output of property listing analysis applied at the point of decision.
What practical steps can investors take to analyse property data?
Knowing the theory is one thing. Applying it to a specific property requires a structured process. These steps work whether you are analysing your first buy-to-let or reviewing a portfolio acquisition.
-
Gather and validate core documents. Collect the title register, Energy Performance Certificate, service charge accounts, and any available rental history. Verify that the figures match what the seller or agent has stated.
-
Apply a basic screening rule. The 1% rule, where monthly rent equals at least 1% of the purchase price, is a quick filter for buy-to-let viability. It does not replace full analysis, but it removes obviously poor candidates fast.
-
Build or use a standardised financial template. Calculate NOI, Cap Rate, and cash-on-cash return using consistent inputs. Standardised templates prevent you from comparing properties on different assumptions.
-
Research comparable sales. Cross-referencing tax assessor data with market listings prevents hidden problems from distorted figures. Look at sold prices on the same road within the last 12 months, not just asking prices.
-
Clean and verify your data manually. Property value is best derived from triangulating multiple data sources with manual clean-up to identify discrepancies. A figure that appears in one source but not another warrants investigation before you proceed.
-
Run sensitivity analysis. Model your returns at current interest rates, then at rates 2% higher. Model occupancy at 95%, then at 80%. If the deal breaks under either scenario, factor that risk into your offer.
-
Use tools to fill data gaps. Automated Valuation Models (AVMs) are useful for initial screening but detailed manual underwriting remains necessary for deep investment decisions. Use AVMs to filter, then apply manual analysis to the properties that pass. For UK-specific data, Offersmart provides a 5-year value forecast, rental yield estimates, and running cost breakdowns that support this final stage. You can also use data to make a property offer with confidence once your analysis is complete.
Key takeaways
Effective property data analysis combines financial metrics, verified comparable sales, and location intelligence to produce investment decisions grounded in evidence rather than assumption.
| Point | Details |
|---|---|
| Definition matters | Property data analysis transforms raw records into measurable metrics like NOI and Cap Rate. |
| Data quality is critical | Fragmented or unverified data produces flawed analysis; always triangulate multiple sources. |
| Stress testing is non-negotiable | Model returns under adverse conditions before committing to any purchase price. |
| Tools accelerate accuracy | Integrated platforms reduce manual errors and surface location intelligence unavailable in spreadsheets. |
| Structured steps prevent costly errors | A repeatable process from document gathering to sensitivity analysis protects every investment decision. |
Why I think most investors underestimate data quality
The debate in property investment circles tends to focus on which metrics to use. Cap Rate versus cash-on-cash return. Gross yield versus net yield. That debate misses the more important question: how reliable is the data behind those calculations?
I have seen investors build detailed financial models on rent roll figures that were never verified against actual tenancy agreements. The model looked credible. The investment was not. The numbers were accurate to the spreadsheet and wrong about the property.
The discipline that separates consistent investors from occasional ones is not analytical sophistication. It is data hygiene. Verifying a figure takes ten minutes. Unwinding a bad acquisition takes years.
Sensitivity analysis deserves the same attention. Most investors run one scenario: the optimistic one. Running three scenarios, base case, downside, and stress case, takes an extra hour and tells you whether you are buying a property or buying a hope. The investors I respect most treat the stress case as the real case and treat any upside as a bonus.
The tools available now, including Offersmart for UK buyers, make data gathering faster than it has ever been. That speed is only valuable if you use it to verify more, not to skip verification entirely.
— Rhys
How Offersmart supports your property analysis
Property data analysis is only as useful as the tools you use to apply it.

Offersmart is built for UK buyers and investors who want clear financial answers before making an offer. Enter any UK property address or paste a listing link, and Offersmart produces a full buyer report covering comparable local sales, rental yield, estimated ROI, flood risk, crime data, and a 5-year value forecast. The property investment calculators cover mortgage costs, running expenses, and cash flow, giving you the complete financial picture in one place. No manual data gathering. No spreadsheet errors. Just verified, property-specific numbers that tell you what to offer and why.
FAQ
What is property data analysis in simple terms?
Property data analysis is the process of gathering and examining property records, sales data, and financial figures to determine a property's true value and investment potential. It replaces guesswork with measurable evidence.
What financial metrics are most important in property analysis?
Net Operating Income (NOI), Capitalisation Rate (Cap Rate), and cash-on-cash return are the three core metrics. Together they show a property's profitability, yield, and return on actual cash invested.
How long does it take to analyse a property properly?
Experienced analysts spend 30–60 minutes per property verifying market rents and modelling core financial metrics. Automated tools like Offersmart reduce initial data gathering significantly, but manual verification of key figures remains necessary.
Why is stress testing important in property data analysis?
Stress testing reveals whether a property remains profitable if interest rates rise or vacancy increases. A deal that only works under ideal conditions carries far more risk than the headline numbers suggest.
What is the difference between an AVM and a full property analysis?
An Automated Valuation Model (AVM) provides a quick estimated value based on comparable sales data. A full property analysis adds financial modelling, risk assessment, location intelligence, and manual data verification, making it suitable for actual investment decisions rather than initial screening.