

Reading property market trends is the process of interpreting key data points, such as supply levels, sales velocity, and price movements, to gauge current conditions and anticipate where the market is heading. For UK buyers and investors, this skill separates confident decisions from costly mistakes. The core discipline is known in the industry as real estate market analysis, and it draws on a defined set of metrics rather than gut feeling or newspaper headlines. This guide explains how to read property market trends, which numbers matter most, and how to apply local data to make offers you can defend with evidence.
What key metrics indicate property market health?
Property market health is measured by four core indicators: months of supply, days on market, sale-to-list price ratio, and price per square foot. Each tells a different part of the story, and reading them together gives you a reliable picture.
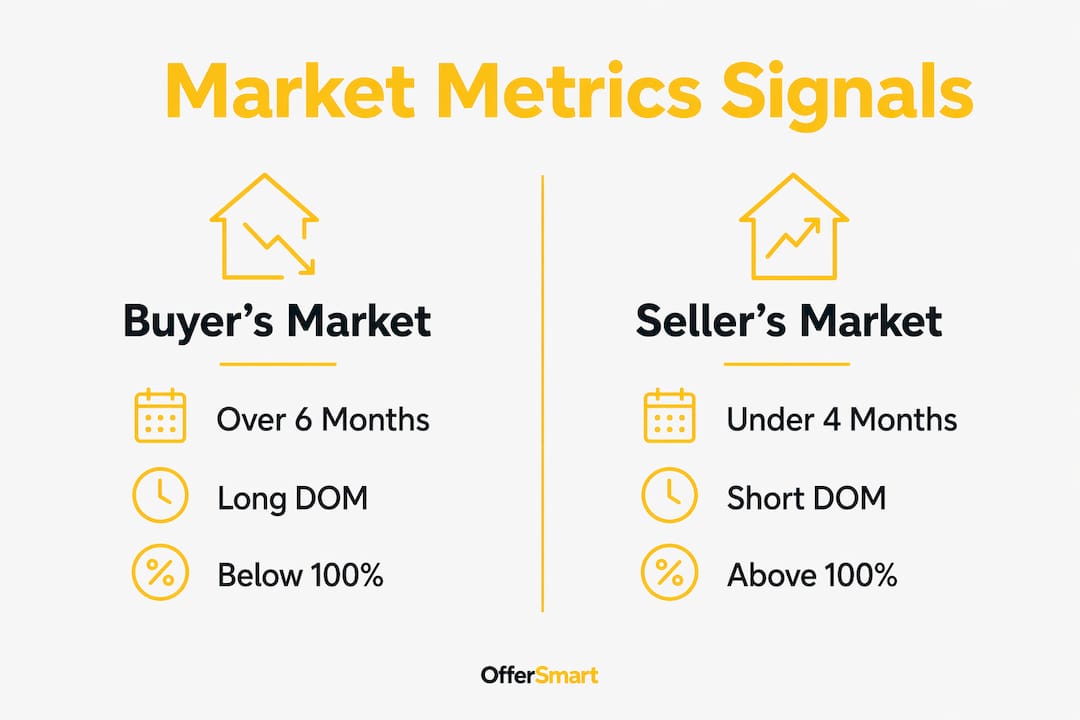
Months of supply measures how long it would take to sell every listed home at the current sales pace. Under 4 months signals a seller's market; over 6 months signals a buyer's market. That threshold matters because it tells you how much negotiating power you realistically hold before making an offer.
Days on market (DOM) tracks how long properties sit before going under offer. A typical home spent 53 days on market as of june 2026, with pending sales up 3.7% over seven consecutive months. Rising DOM means buyers have more time and leverage; falling DOM means competition is intensifying and you need to move faster.

Sale-to-list price ratio compares the final agreed price to the original asking price. A ratio above 100% confirms buyers are bidding over asking, which defines a competitive market. A ratio below 98% suggests sellers are accepting discounts, giving you room to negotiate.
Price per square foot normalises value across different property sizes. Monitoring local price per square foot can reveal emerging demand in specific streets or postcodes before headline prices reflect the change. This metric is particularly useful when comparing recent sold prices across a neighbourhood.
Pro Tip: Never rely on a single metric. Triangulating supply, demand, and economic indicators gives a more reliable market read than any one number alone. Falling DOM combined with a rising sale-to-list ratio confirms a strong seller's market far more reliably than either figure in isolation.
| Metric | Buyer's market signal | Seller's market signal |
|---|---|---|
| Months of supply | Over 6 months | Under 4 months |
| Days on market | Rising or above 60 days | Falling or below 30 days |
| Sale-to-list ratio | Below 98% | Above 100% |
| Price per sq ft | Flat or declining locally | Rising ahead of median prices |
How do property market cycles affect your buying strategy?
Real estate markets move through four phases: recovery, expansion, hyper-supply, and recession. Recognising which phase you are in shapes every decision, from when to buy to how aggressively to offer.
-
Recovery. Prices are low, vacancy rates are high, and transaction volumes are thin. Buyers with patience and cash find the best long-term value here, though confidence in the market is low and financing can be harder to secure.
-
Expansion. Demand rises, new listings increase, and prices climb steadily. This is the phase most buyers experience as a "normal" market. Competition grows, but properties still offer fair value if you act on good local data.
-
Hyper-supply. New construction and listings outpace demand. Prices soften, DOM rises, and sellers become more flexible. Buyers gain negotiating power, but investors should scrutinise rental demand carefully before committing.
-
Recession. Transaction volumes fall sharply, prices drop, and distressed sales appear. Experienced investors treat this as an opportunity, though buyers relying on short-term resale should proceed cautiously.
Identifying your current phase requires reading leading, coincident, and lagging indicators in the right order. Mortgage application volumes and new listing counts are leading indicators; they move before prices do. Sales volumes are coincident. Median prices are lagging. Relying on median prices alone means you are always reacting to history rather than anticipating what comes next.
Pro Tip: Strategic positioning within a cycle reduces risk more effectively than trying to time the exact market bottom. Buying in late recovery or early expansion, with solid local data behind you, consistently outperforms waiting for perfect conditions.
Why national averages can mislead UK buyers
National averages obscure the local detail that actually determines whether a specific property is good value. National data masks regional and sub-market volatility, and successful buyers focus on neighbourhood-level figures instead.
Consider what happened in mid-2026. Listings rose 2.4% year on year and pending sales grew 3.7%, suggesting an active market overall. Yet at the same time, median asking prices posted their steepest annual decline in nearly a decade. Those two facts coexist because different submarkets behave differently. A postcode in Manchester city centre and a village in rural Shropshire will rarely follow the same trajectory, even within the same quarter.
The metrics to track at local level are:
- Local days on market. A street where properties sell in 14 days tells a very different story from the national 53-day average.
- Recent comparable sales. Sales on the same road within the past 90 days are the most reliable benchmark for what a property is actually worth.
- Local price per square foot. Sudden rises in a specific postcode signal demand that has not yet appeared in headline data.
- Rental vacancy rates. Tight vacancy supports rental growth, but a temporary spike in empty properties can mislead on underlying demand. Always read vacancy alongside local employment and population data.
Local data helps buyers make better offers precisely because it reflects conditions on the ground rather than a smoothed national average. Understanding how house prices are determined at a local level gives you the context to spot both overpriced listings and genuine opportunities.
Pro Tip: When analysing a target area, pull data for at least three postcodes around your preferred location. Comparing micro-markets reveals whether your target street is priced in line with its neighbours or carrying a premium that the data does not support.
Practical steps for analysing property market data
Analysing property market data follows a repeatable process. The steps below work whether you are a first-time buyer assessing one street or an investor comparing multiple areas.
-
Collect active, pending, and sold listings. Pull current listings, properties under offer, and completed sales for your target postcode. You need all three to calculate supply, demand, and velocity accurately.
-
Calculate months of supply. Divide the number of active listings by the average monthly sales rate. A result under 4 means sellers hold the advantage; over 6 means you do.
-
Calculate the absorption rate. Divide the number of homes sold in a period by the total available inventory, then multiply by 100. A high absorption rate confirms strong demand and supports asking prices.
-
Track trends over 3, 6, and 12-month windows. A single month of data is noise. Three months shows a direction. Twelve months shows a pattern. Use all three windows to separate seasonal fluctuation from genuine market shifts.
-
Compare sale-to-list ratios for recent sales. Pull the last 20 completed sales in your target area and calculate the average ratio. This tells you what sellers are actually accepting, not what they are asking.
-
Cross-reference with leading indicators. Check mortgage approval volumes from the Bank of England and RICS survey data on buyer enquiries. These move before prices do and give you advance warning of direction changes.
The sources for this data in the UK include HM Land Registry sold price records, Rightmove and Zoopla listing data, RICS monthly market surveys, and the Office for National Statistics house price index. Each source has a different lag time, so combining them gives a more complete picture than any single feed.
Pro Tip: Set a consistent review date each month to update your data. Markets shift gradually, and a monthly discipline of analysing property market data stops you from making decisions based on figures that are three months out of date.
Key takeaways
Reading property market trends accurately requires combining multiple metrics, local data, and cycle awareness rather than relying on any single national figure.
| Point | Details |
|---|---|
| Use four core metrics | Months of supply, DOM, sale-to-list ratio, and price per sq ft together give a reliable market picture. |
| Identify the cycle phase | Recovery and expansion favour buyers who act on data; hyper-supply and recession require extra caution on resale value. |
| Reject national averages | Local postcode data consistently outperforms national figures for predicting what a specific property is worth. |
| Read leading indicators first | Mortgage applications and new listing volumes move before prices do, giving you time to act rather than react. |
| Review data monthly | Consistent monthly tracking separates seasonal noise from genuine market direction changes. |
What I have learnt from reading markets the hard way
I spent years watching buyers, including people I knew well, make expensive decisions based on a single data point. Someone sees a headline that says prices are rising and pays over the odds. Someone else reads that the market is cooling and waits so long they miss a genuinely good property at fair value.
The mistake is treating market data as a verdict rather than a conversation. The metrics do not tell you what to do. They tell you what conditions you are operating in, and that is a very different thing. A seller's market does not mean every property is worth its asking price. A buyer's market does not mean every seller will accept a low offer.
What actually works is building a habit of local data review before you even start viewing properties. Know the average DOM for your target streets. Know what the last five comparable sales achieved. Know whether the sale-to-list ratio in that postcode is trending up or down. When you walk into a negotiation with that information, you are not guessing. You are working from evidence.
The other lesson I would pass on is this: thorough property research saves real money. Not in a vague, theoretical sense. In the specific sense that buyers who understand local market conditions consistently make better offers, avoid overpaying, and negotiate from a position of confidence rather than anxiety.
— Rhys
Put your market knowledge to work with Offersmart
Understanding market trends is the foundation. Applying them to a specific property is where decisions get made.

Offersmart is built for exactly that moment. Enter a property address or paste a listing link, and Offersmart analyses recent local sales, including properties on the same road, to tell you what you should realistically offer. It calculates rental value, estimated ROI, flood risk, and a 5-year value forecast, giving you a complete financial picture before you commit. Use the Offersmart property calculators to apply the data insights from this guide directly to your next purchase. No guesswork. No overpaying. Just clear, evidence-based decisions.
FAQ
What does months of supply mean in property?
Months of supply measures how long it would take to sell all current listings at the existing sales pace. Under 4 months indicates a seller's market; over 6 months indicates a buyer's market.
How do I know which phase of the market cycle I am in?
Check leading indicators first, specifically mortgage application volumes and new listing counts, as these move before prices change. Coincident indicators like sales volumes confirm the direction, while median prices are lagging and reflect past conditions.
Why should I not rely on national average house prices?
National averages mask local and sub-market variation, meaning a rising national figure can coexist with falling prices in your target postcode. Local comparable sales and days on market are far more reliable for assessing a specific property's value.
What is the sale-to-list price ratio and why does it matter?
The sale-to-list price ratio compares the final agreed price to the original asking price. A ratio above 100% means buyers are bidding over asking; below 98% means sellers are accepting discounts, which directly affects your negotiating position.
How often should I review property market data?
A monthly review is the minimum for buyers actively searching. Tracking 3, 6, and 12-month windows together separates seasonal fluctuation from genuine market direction changes, giving you a more reliable basis for making a data-driven offer.